Price Bitcoin initially stabilized around 7500 after falling to 6500 earlier this week. Where will the Bitcoin price go by early December? Altcoins also showed signs of recovery, what does this mean for believers in Alt Season?
Bitcoin: short-term, cautiously optimistic, medium-term, cloud
Bitcoin's price initially rebounded from its November low of $ 6, but the short and medium term outlook for the leading cryptocurrency could turn out to be two different pictures. In the short term, preliminary data show that market sentiment has turned slightly positive along with the rebound in price.
But Crypto Fear & Greed Index Rises
We have also seen preliminary signals of recovery, but we will not rule out a rebound back, and the coming days will be decisive if there is a real reversal or just a short-lived rally. Figure 2a shows that BTCUSDT initially formed an uptrend on the 3-hour chart (red channel). The rebound has reached the upper end of the channel, which is also near the main resistance line since late October (yellow line).
Both the Ending Oscillator and the RSI have made higher highs, indicating a build-up in upward momentum. From here, two scenarios can occur. 1) The 3-hour chart may first find lower support for the last uptrend before retesting October resistance, given that the pair should make a higher low. 2) The pair is consolidating at current levels until the momentum disappears. If seen, a breakout of the lower end of an uptrend could be the first warning sign of further corrections. If we start to see a 3-hour rise, like our slope, this will further support the likelihood of the first scenario.
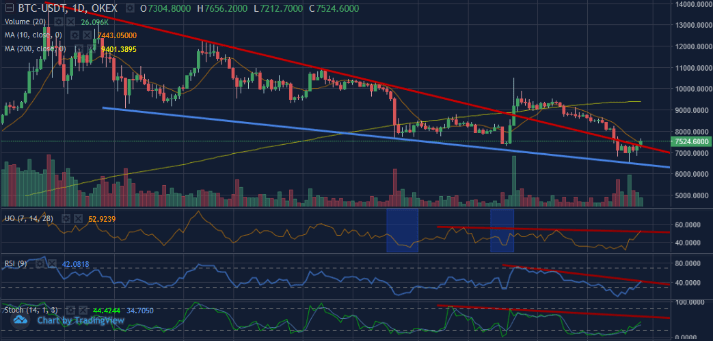
However, things will be less optimistic if we see it in terms of the daily chart. Figure 2b shows the reversal of BTCUSDT and the rebound has brought the price back above the June resistance levels (red line). We watched the October rally push price above resistance levels; However, the pair was unable to turn it into support as the rally ended.
While the reversal is still too early at this point, we would have liked to see these momentum indicators make higher highs, but this has not happened yet. If the rally momentum fails, a retest of the blue support line cannot be ruled out.
Longer term, Sentix data suggests that some investors still believe Bitcoin remains overvalued. Sentix Bitcoin Strategic Bias measures the investor perception value of Bitcoin over six months. It reflects the strategic perspective of market participants, as well as their core beliefs and perceptions of value for the cryptocurrency market. The offset has been moving in the downtrend since August. Negative perceptions can prevent investors from entering the market at the moment, especially for long term HODLs.
Alt season: a long way
Although the main altcoins have not reached their recent lows, we are still very far from the true beginning of the “alt season”.
The broader altcoins made their third attempt to break out of the downtrend channel of market capitalization in early November. At the same time, they were trying to break above the 365-day moving average (orange line). As the momentum of the rally weakened, the altcoins retreated into the channel in late November.
The lower end of the channel (blue line) appears to be decent support at this point. However, as the general conservative sentiment persists, we believe that additional consolidation is needed for the altcoin market capitalization before the next breakout attempt occurs. This chart can be a quick way to gauge the broader perception of the altcoin market.