- What is the Keltner channel?
- Interpretation of Keltner channels
- How to calculate the Keltner channel
- Best Settings for Keltner Channels
- Strategies for working with the Keltner channel
- Rollback strategy
- Breakout strategy
- Combination of pullbacks and breakouts
- Keltner Channels vs Bollinger Bands
- Keltner Channels vs Bollinger Bands: Key Differences
- Calculation method
- Volatility view
- Signal interpretation
- Which is better: Keltner Channels or Bollinger Bands?
- Conclusion
The Keltner Channel is a versatile tool that helps retail cryptocurrency traders identify trends, potential reversals, and market volatility. It combines moving averages and average true range to provide insight into the market.
Main conclusions:
- The Keltner Channel consists of three lines: a middle line (usually an exponential moving average), an upper and a lower line.
- Keltner channels provide insight into price volatility. Widening channels indicate an increase in volatility, while narrowing channels indicate a decrease.
- Keltner channels are used during pullbacks and channel breakouts, providing traders with opportunities to enter and exit positions based on price movement relative to the channels.
What is the Keltner channel?
The Keltner Channel is a powerful technical analysis tool used by retail traders to gauge volatility, identify trends and potential trend reversals, and make informed trading decisions in the cryptocurrency market. This is a universal indicator that combines elements of both a moving average and “envelope” indicator.
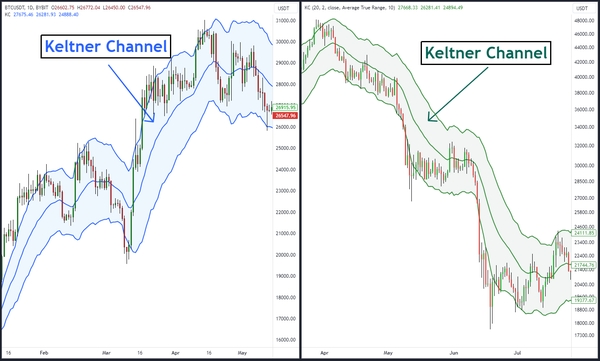
Developed by Chicago grain trader Chester W. Keltner in the 1960s, the Keltner Channel consists of three lines that expand and contract depending on market volatility. The fundamental calculation involves the Exponential Moving Average (EMA) combined with the Average True Range (ATR). To determine trends and possible reversals in the market, traders analyze the position of the current price relative to the Keltner channel, and also take into account the slope of the indicator channel lines.
Interpretation of Keltner channels
The Keltner Channel indicator is quite simple, but it contains a lot of information.
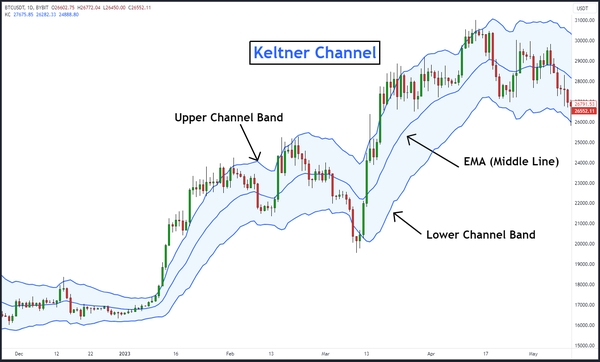
Components of the Keltner channel: The upper band of the channel, the EMA and the lower bend of the channel.
Below is a description of its components.
Middle line (EMA or SMA):The basis of the Keltner channel is the middle line, which is usually the EMA. This line reflects the direction of the trend and acts as the channel's baseline. Traders use different periods for EMA depending on their trading style and time frame. Although the default for the middle line is the 20-period EMA, the middle line can also be a simple moving average (SMA).
Upper channel line: the upper channel line is drawn above the middle line and is obtained by adding a multiple of ATR to the middle line. ATR measures market volatility and traders can adjust the multiplier to suit their risk tolerance. A higher multiplier results in wider channels to account for higher volatility. Traders typically use a multiplier of 2 and an ATR value of 10.
Bottom channel line: The lower channel line, on the contrary, is constructed below the middle line by subtracting from it a multiple of the ATR. This line represents an extreme dip below the mean in an uptrend or a potential deviation from the mean in a downtrend. Again, the default is a multiplier of 2 with an ATR of 10.
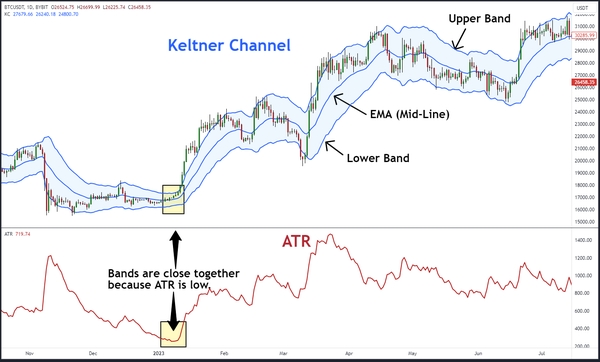
The Keltner Channel provides a visual representation of price volatility, with a widening channel indicating an increase in volatility and a narrowing channel indicating a decrease. As volatility decreases, ranges usually form. If volatility increases, then trends are likely to form.
Trading strategies are created in accordance with market conditions. When market volatility decreases, range trading strategies are used, and when volatility increases, momentum trading and breakout strategies are used.
How to calculate the Keltner channel
Calculating the Keltner Channel involves a few simple steps, mainly based on the ATR and the selected moving average. Most graphics packages include Keltner channels so you don't have to calculate them manually.
However, it is advisable to understand how channels work in order to choose the optimal settings for your strategy. Below is a step-by-step guide to calculating Keltner channels.
Calculation of the Keltner channel
Middle line of the Keltner channel = EMA
Upper band of the Keltner channel = EMA + (2 * ATR)
Lower band of the Keltner channel = EMA – (2 * ATR)
EMA = 20-period exponential moving average
ATR = Average true range over 10 periods
- Select the period for the moving average: The first step is to decide whether to use the center line of the Keltner channel - EMA or SMA. Traders often use the 20-period EMA or SMA, but you can change this value to suit your trading strategy and time frame.
- Calculate Average True Range: ATR is a measure of market volatility and is typically calculated over 10 periods for Keltner channels.
- Determine the Multiplier: The multiplier is a constant value used to adjust the width of the Keltner channel. Typically a value of 2 is used, but you can adjust it to suit your preferences and the volatility level of the cryptocurrency you are trading.
- Calculate the Upper and Lower Channels: To calculate the upper channel line, add the moving average value to the ATR value multiplied by the selected multiplier. Similarly, to calculate the lower line of a channel, subtract the ATR value multiplied by the multiplier from the moving average.
Now that you have calculated the upper and lower lines of the Keltner Channel, you can plot them on your price chart. These lines will change dynamically depending on market conditions, reflecting changes in volatility (i.e. ATR). This dynamic property makes the Keltner Channel a valuable tool for traders, allowing them to adapt to changing market conditions.
Best Settings for Keltner Channels
The optimal Keltner channel settings will vary depending on your trading goals, the cryptocurrency you are trading, and your preferred chart timeframe.
By default, the Keltner Channel uses a 20-period EMA and a 10-period ATR with a 2x multiplier. Any of these settings can be changed to suit your strategy. However, here are some general guidelines to help you choose the best settings.
Moving Average Time Frames: Consider the time frame of your trading. Short-term day traders may prefer lower periods for the moving average, such as the 10-period EMA, while longer-term traders may use the 50-period EMA. Experiment with different time frames to see which one best suits your trading strategy.
Factor: The selected multiplier can be adjusted as it determines the width of the channel and its sensitivity to price movements. A common starting point is a multiplier of 2, but you can choose a higher or lower multiplier according to the volatility of the cryptocurrency you are trading. Higher multipliers expand the channel, while lower ones narrow it. Day traders typically use lower odds, such as 1,5, due to the shorter time frame of the chart.
Timeframe Average True Range: Another way to adjust the width of the upper and lower bands is the number of periods used in the ATR. A shorter return period, such as 7, will result in more volatile bands. A longer return period will result in smoother streaks. If a day trader wants to smooth out the bands, he can use a longer return period, such as 20.
Remember that there is no one-size-fits-all approach when it comes to the best Keltner channel settings. Traders should adjust parameters according to market conditions and their individual preferences, constantly refining their strategy based on experience and analysis.
Strategies for working with the Keltner channel
The Keltner Channel is primarily used as a trend and momentum indicator. There are several different strategies, depending on your trading style.
Rollback strategy
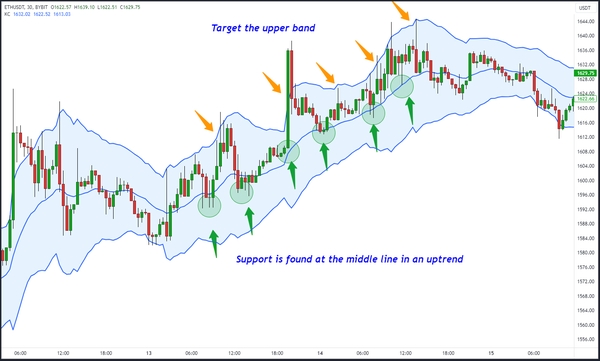
When the market is trending higher, prices generally remain at the top of the Keltner Channel. The moving average can be seen as a support zone, so when prices fall, the moving average can be where buyers decide to buy.
To implement this strategy, you first need to wait for prices to reach the midline. If the price temporarily falls below the center line, wait until it reaches the center line again to enter the market. Then set your stop loss approximately halfway between the moving average and the lower channel line. Aim for the top band so that your risk to reward ratio is around 1:2.
In a downtrend, the opposite will be true, unless prices are held in the lower zone of the Keltner Channel. In such cases, a rebound to the moving average provides an opportunity for short sellers to enter the market. The stop loss should be placed approximately halfway between the moving average and the upper band, and the target should be located on the lower band.
Breakout strategy
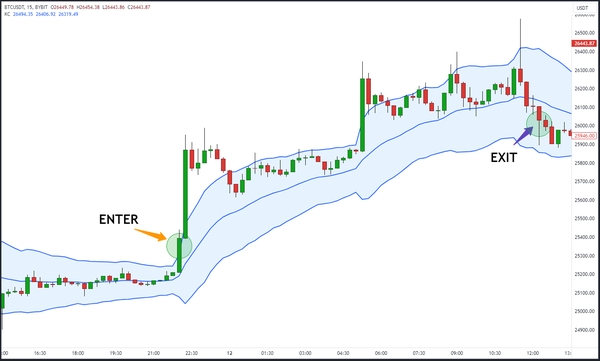
There are times when the market moves quickly and takes the lead. In such cases, you can use a Keltner channel breakout to take advantage of the fast movement.
By placing the indicator on the chart, wait for the price to close above the upper or below the lower band.
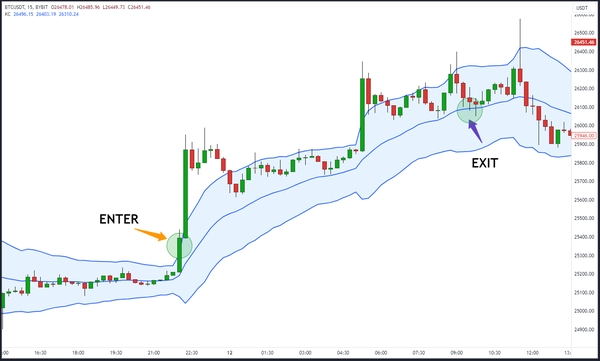
In the example above, Bitcoin is rising, forming a closing candle above the upper band on the 15-minute chart. The trader will take this as a signal to buy. The exit strategy involves setting a dynamic trailing stop based on the center line (EMA). Once the price touches or crosses the midline, the trader will close the trade.
During strong uptrends, prices tend to remain at the top of the Keltner Channel. This allows buyers to lock in a profitable trade as the moving average has a chance to catch up with rising prices, giving traders the opportunity to exit a position while prices remain favorable.
Combination of pullbacks and breakouts
You may notice that with the rollback strategy, the long position is entered at the middle line, and with the breakout strategy, the exit also occurs at this area.
You can combine both strategies by going long on the breakout, but instead of exiting at the center line, place a stop loss halfway between the center line and the bottom band.
This decision depends on whether you want more flexibility with your dynamic stop loss to stay in the position for a longer period of time. However, sometimes this may mean exiting a position at a less favorable price.
Keltner Channels vs Bollinger Bands
When conducting technical analysis, traders are often faced with the question of what is better to use: Keltner channels or Bollinger bands. Both indicators are popular volatility indicators that help traders identify potential market entry and exit points, but they have distinct differences in calculation and interpretation.
Keltner Channels vs Bollinger Bands: Key Differences
Calculation method
Keltner channels: Keltner channels use ATR to measure volatility and create dynamic channel boundaries. The upper and lower lines of the Keltner channel are determined by adding or subtracting the ATR from the moving average, respectively.
Bollinger Bands: Bollinger Bands use standard deviation to measure price volatility. The bands are made up of three lines: the middle line is a simple moving average, and the upper and lower bands are calculated by adding and subtracting multiples of the standard deviation from the middle line.
Volatility view
Keltner channels: Keltner channels provide a smoother representation of volatility, resulting in less responsive channel lines. They may be better suited for traders looking for clearer trend signals.
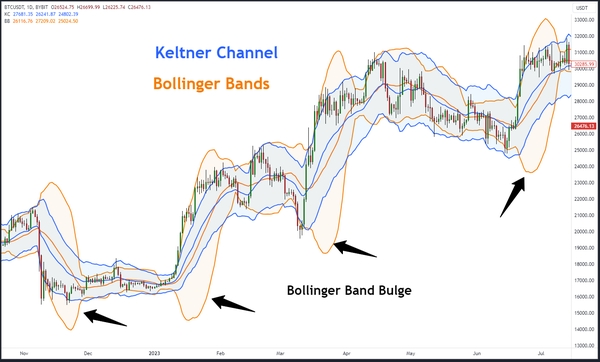
Bollinger Bands: Bollinger Bands are more responsive to rapid price changes because they use a standard deviation. This makes them sensitive to short-term price shocks and can result in very wide bands. (See the bulges of the Bollinger Bands in the picture above).
Signal interpretation
Keltner channels: Keltner channels are often used to determine trend direction and potential breakouts when price crosses the channel boundaries. Traders can rely on Keltner channels to confirm a trend.
Bollinger Bands: Bollinger Bands are commonly used to identify overbought and oversold conditions. When the price touches or crosses the upper band, it may indicate overbought, while touching or crossing the lower band may indicate oversold conditions.
Which is better: Keltner Channels or Bollinger Bands?
The choice between Keltner Channels and Bollinger Bands ultimately depends on your trading style and goals. There is no clear best answer as both indicators provide unique insight into market volatility.
The Keltner Channels indicator is preferred by traders who value smoother trend signals and want to focus on trend confirmation. This indicator can be useful in trending markets where clear breakout signals are required.
The Bollinger Bands indicator is more difficult to use to find good signals, since its volatility indicator can significantly distort the values of the bands. Therefore, Bollinger Bands are better suited for range-bound markets and help identify price extremes.
If you are looking for trends and impulse breakouts, then the Keltner channels will be more useful. In range-bound markets, Bollinger Bands can help identify overbought and oversold levels.
Conclusion
While Keltner channels are a valuable tool for cryptocurrency traders, it is necessary to understand their limitations. They can generate false signals in low-volatility markets, lag in fast-moving environments, and require constant adjustment. To maximize their effectiveness, traders should combine Keltner Channels with other indicators and strategies.